I have some multi echo scans of the placenta and I’m trying to measure T2*.
@akuurstr
I have some multi echo scans of the placenta and I’m trying to measure T2*.
@akuurstr
Hi Emily,
cfmm-nipype-interfaces has functionality for fitting complex data to a mono-exponential model using non-linear least squares. See this file:
If a mono-exponential model is not a good assumption for your data, then I would suggest looking into non negative least squares:
You can also look into these software packages:
NiftyFit
analyzennls
Siemens MapIt
Do you have complex data, or only the magnitude?
If you have magnitude data, then it would be fairly simple to estimate the T2* for mono-exponential data in python.
Please be aware that this estimate is only unbiased for high SNR (SNR>5). Since you have magnitude scans, your data is Rician distributed. Least squares is the best linear unbiased estimate for Gaussian noise. Rician distributions can be approximated by Gaussian when SNR>5, but when using a Gaussian estimator (least squares) with low SNR Rician data, the least squares estimation can be biased.
import os
import time

import nibabel as nib
import numpy as np
from scipy.optimize import curve_fit
from vidi3d import compare3d


def model_monoexponential_R2Star(TE, A, R2star, b):
    return A * np.exp(-TE * R2star) + b


def calculate_r2star(img, te_list):
    orig_shape = img.shape
    img = img.reshape(np.prod(orig_shape[:-1]), orig_shape[-1])

    param_estimate_variance = np.empty(shape=img.shape[0], dtype='float')
    r2_img = np.empty(shape=img.shape[0], dtype=img.dtype)
    for pixel_index in range(r2_img.shape[0]):
        try:
            fit = curve_fit(model_monoexponential_R2Star, te_list, img[pixel_index, :])
            r2_img[pixel_index] = fit[0][1]
            param_estimate_variance[pixel_index] = fit[1][1, 1]
        except RuntimeError as e:
            r2_img[pixel_index] = param_estimate_variance[pixel_index] = np.NAN

    img = img.reshape(orig_shape)
    r2_img = r2_img.reshape(orig_shape[:-1])
    param_estimate_variance = param_estimate_variance.reshape(orig_shape[:-1])

    return r2_img, param_estimate_variance

if __name__=='__main__':
    # define path to nifti file
    file = '/path/to/nifti/file'
    # define te times
    te_list = [list of te times]
    # define a path for the output file
    output_name = 't2star.nii.gz'
    output_dir = os.path.dirname(output_name)

    t1 = time.time()
    # get data
    nifti_obj = nib.load(file)
    img = nifti_obj.get_fdata()
    # calculate r2*
    r2_img, param_estimate_variance = calculate_r2star(img, te_list)
    # get t2*
    t2_img = 1.0 / r2_img
    t2 = time.time()
    print(f'processing time (s): {t2 - t1}')

    # save t2* image
    t2_nifti_object = nib.Nifti1Pair(t2_img, nifti_obj.affine)
    nib.save(t2_nifti_object, output_name)

    # save parameter estimate variance
    variance_nifti_object = nib.Nifti1Pair(param_estimate_variance, nifti_obj.affine)
    nib.save(variance_nifti_object, os.path.join(output_dir, 'param_variance.nii.gz'))

    diverged = np.isnan(param_estimate_variance)
    inf_variance = np.isinf(param_estimate_variance)
    invalid = diverged | inf_variance

compare3d((img[..., 0], t2_img, param_estimate_variance), subplotTitles=['img', 't2star', 'variance'], colormap=[None, 'hot', None])Hi Alan,
Thanks so much for your response. I only have magnitude data.
Hi Alan,
Thanks so much for this code, it works beautifully. Is there a way to write the output to .nii? I’ll use this output to run statistics.
Thanks,
Emily
The numpy array can be saved to a nifti file using nibabel.
I’ve edited the code in the above post to save the image to a file.
Please also be aware that values where a fit could not be found (because the data does not fit the model and therefore the optimization algorithm diverges) are marked as np.NAN (not a number).
I’ve also changed the code to output a nifti image of the parameter estimate variance which is a measure of error in the estimate. It’s important when doing your statistics to make sure the values you are including are good estimates of the parameter.
I’ll also note that if the t2 image and the parameter estimate variance images have nans and inf in them, then the level windowing of viewers may be thrown off. You might need to manually adjust the level and widow to be closer to values in the valid voxels.
Hi @akuurstr ,
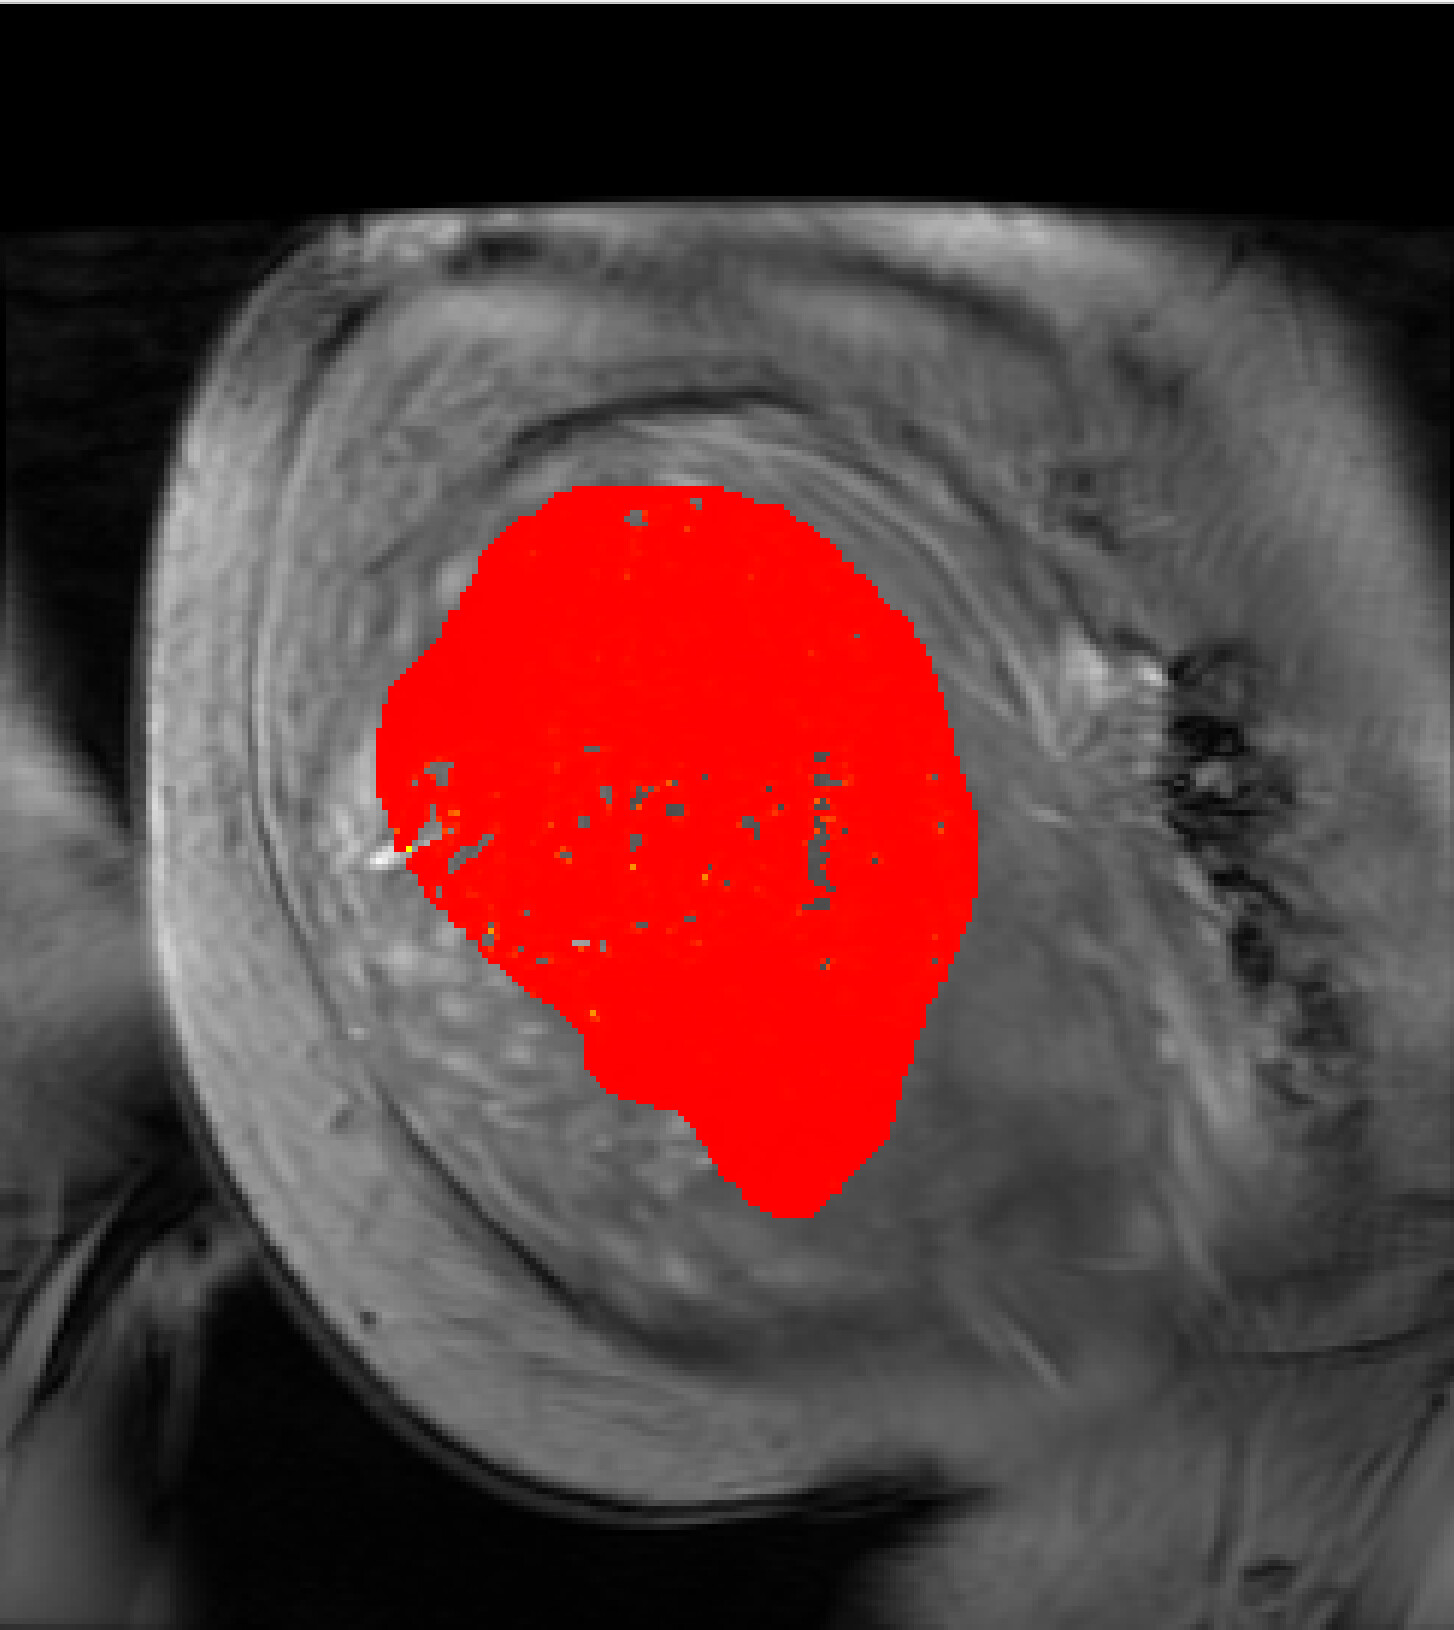
I’ve been running the code for T2* calculation, but I’m occasionally getting NaNs or numbers that are huge (e.g., sometimes as big as -318229.8 or 4627.9, etc.). Is this to be expected or is something going wrong?
I’ve attached an image of the resulting T2* map. For the most part (in the red areas), the values are where they’re expected (i.e., within the 15-60 range). The empty areas are NaNs, and the yellow areas are extreme outliers (150- >3000).
Thanks for your help!
Emily
Just noticed @akuurstr didn’t respond yet – curious to know if the intensities values in the different echos are reasonable in those voxels? I recall the pipeline also outputs a map or mask with goodness of fit parameters too, wondering if mask overlaps with the bad voxels?
If it is just R2* fitting (and not QSM), there are alternative tools that could be used too…
oops just noticed the earlier messages, so some of what I mentioned is probably already covered above
I think I’ve narrowed the NaNs down to a problem with the R2* fitting, in that some values are too large (either super small or super big), so there’s an overflow problem. There’s an exception in the code that says if you get a runtime error, assign it NaN.
I tried increasing the float value to float128 but that didn’t help. But even if it did, I think we’d still end up with extreme values.
But I’m still not sure why we’re getting extreme values in the first place!
@akhanf,
Emily was not using the pipeline since she doesn’t have complex data. As you’ve probably seen above, I provided a simple code snippet for fitting to magnitude data in high SNR situations.
@emilynichols,
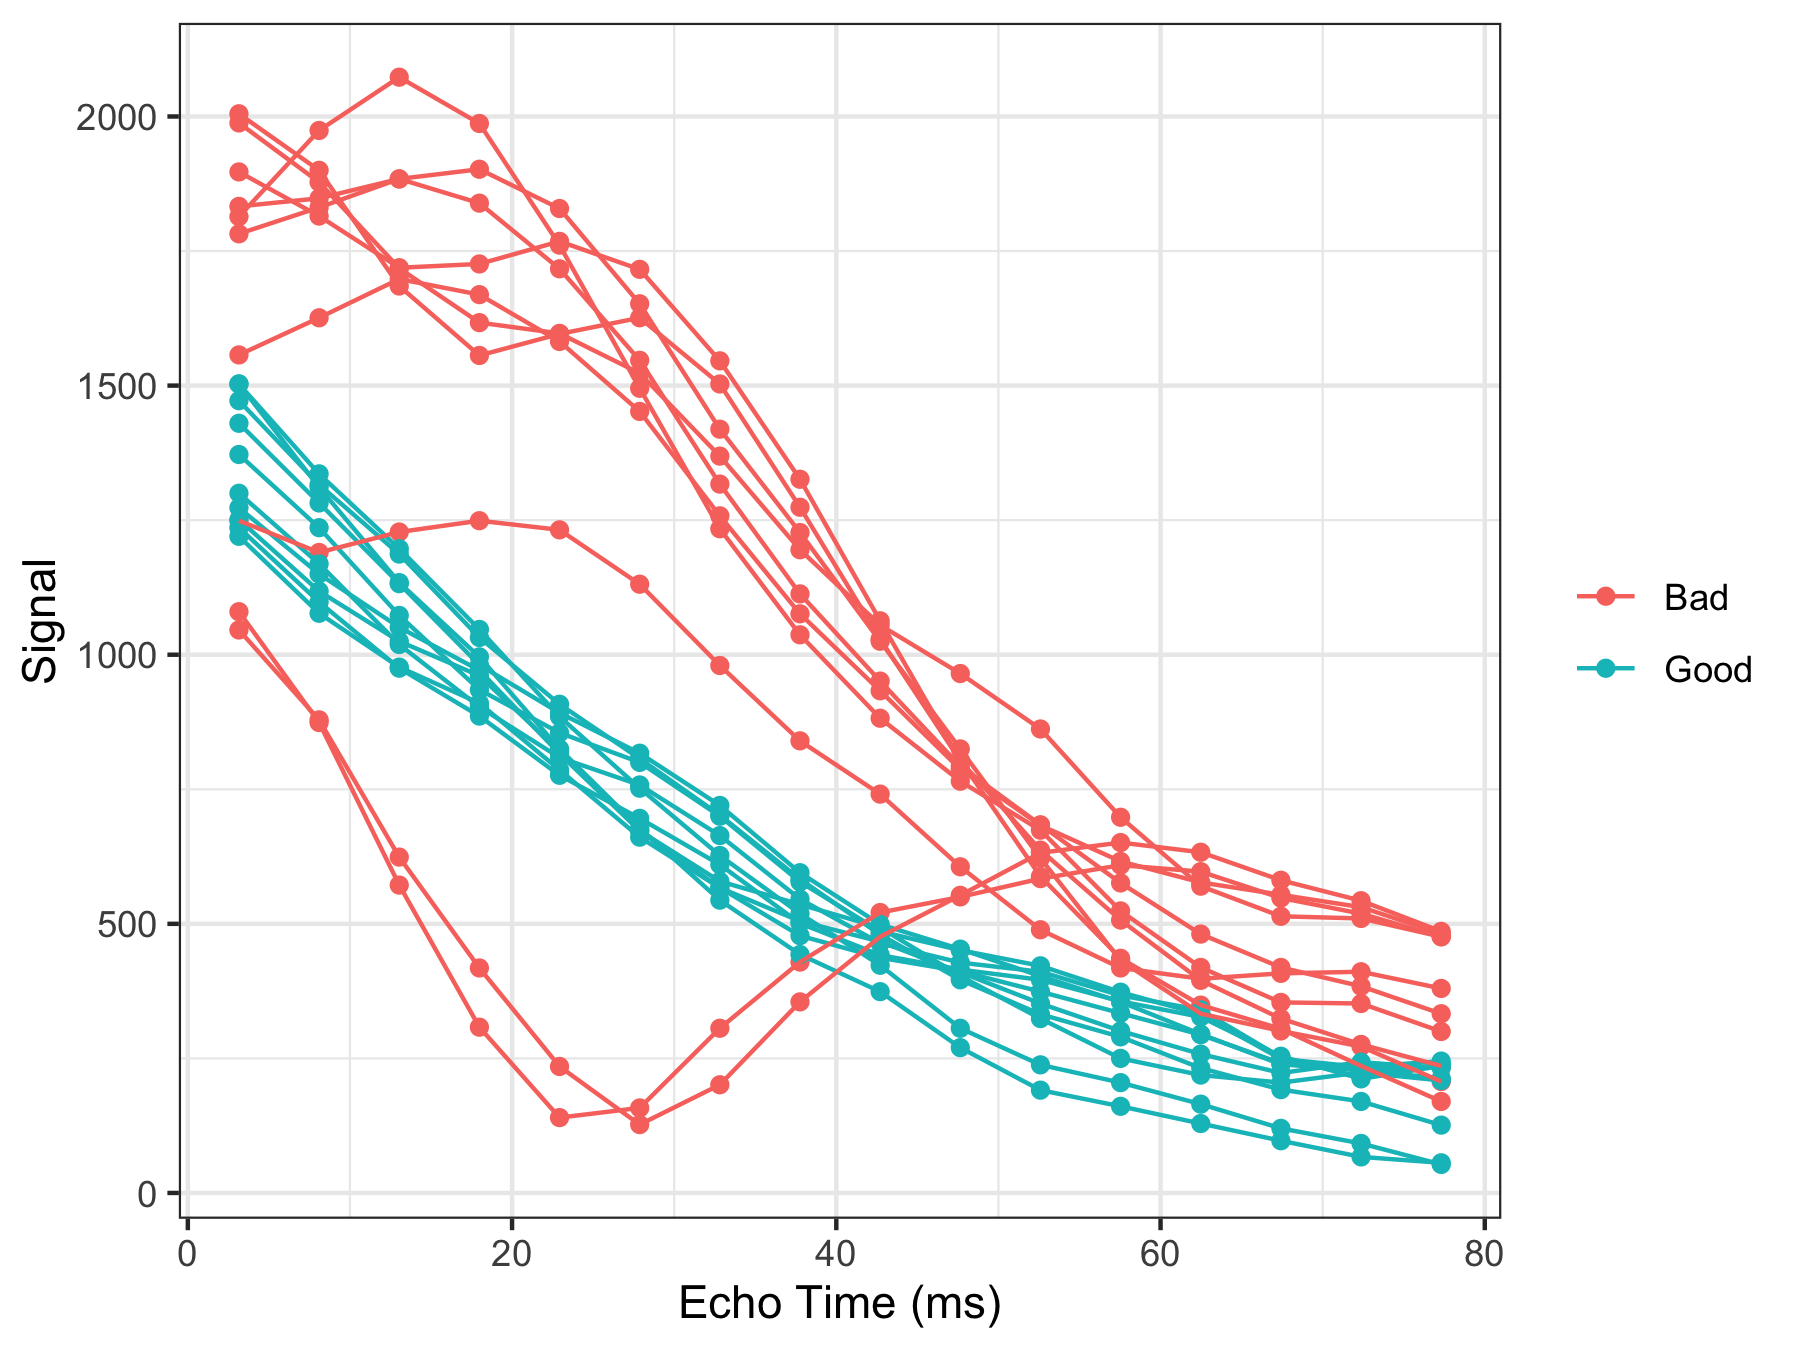
As Ali suggested, you should pick a location that’s failing and plot the intensity vs TE to see if you’re data fits a monoexponential model in those locations. There’s lots of reasons why a fit can fail, but viewing your data is the first step to getting an idea of what’s going on. Consider matplotlib for this.